Hello! I’m Peter!
Blog
-
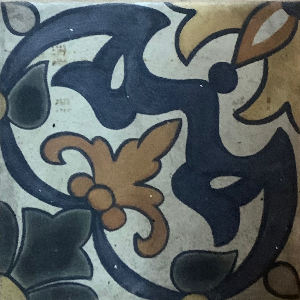
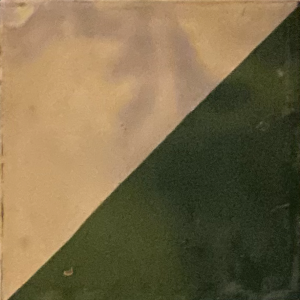
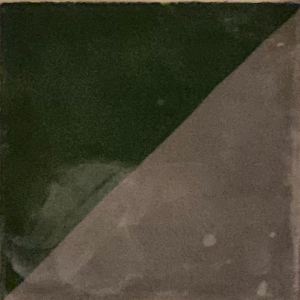
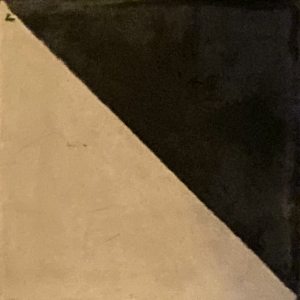
Torus tilings
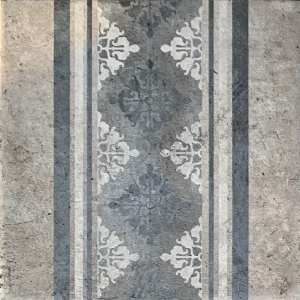
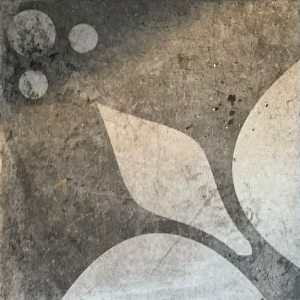
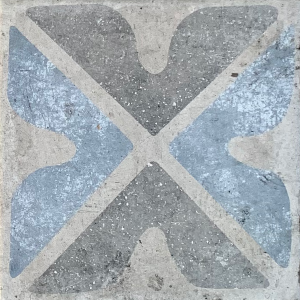
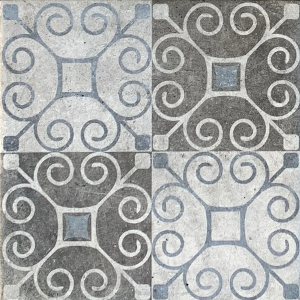
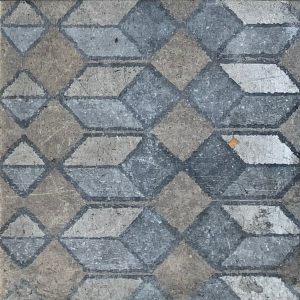
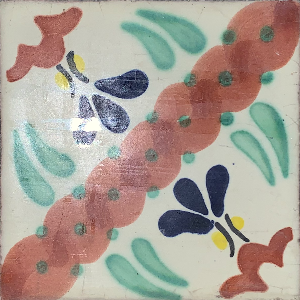
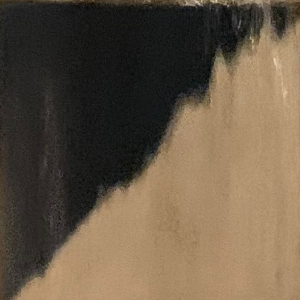
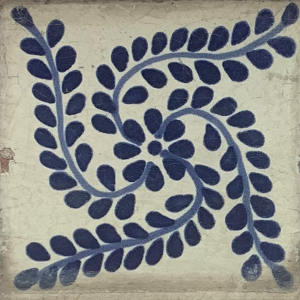
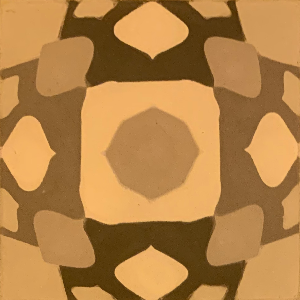
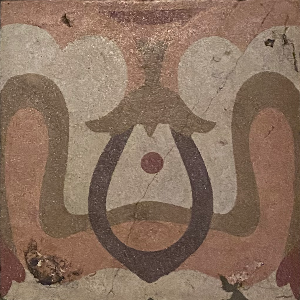
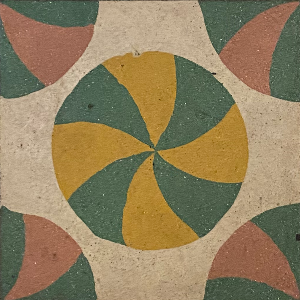
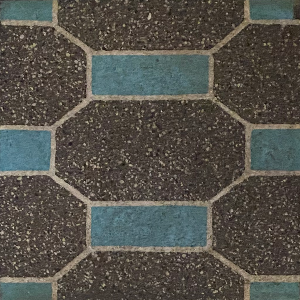
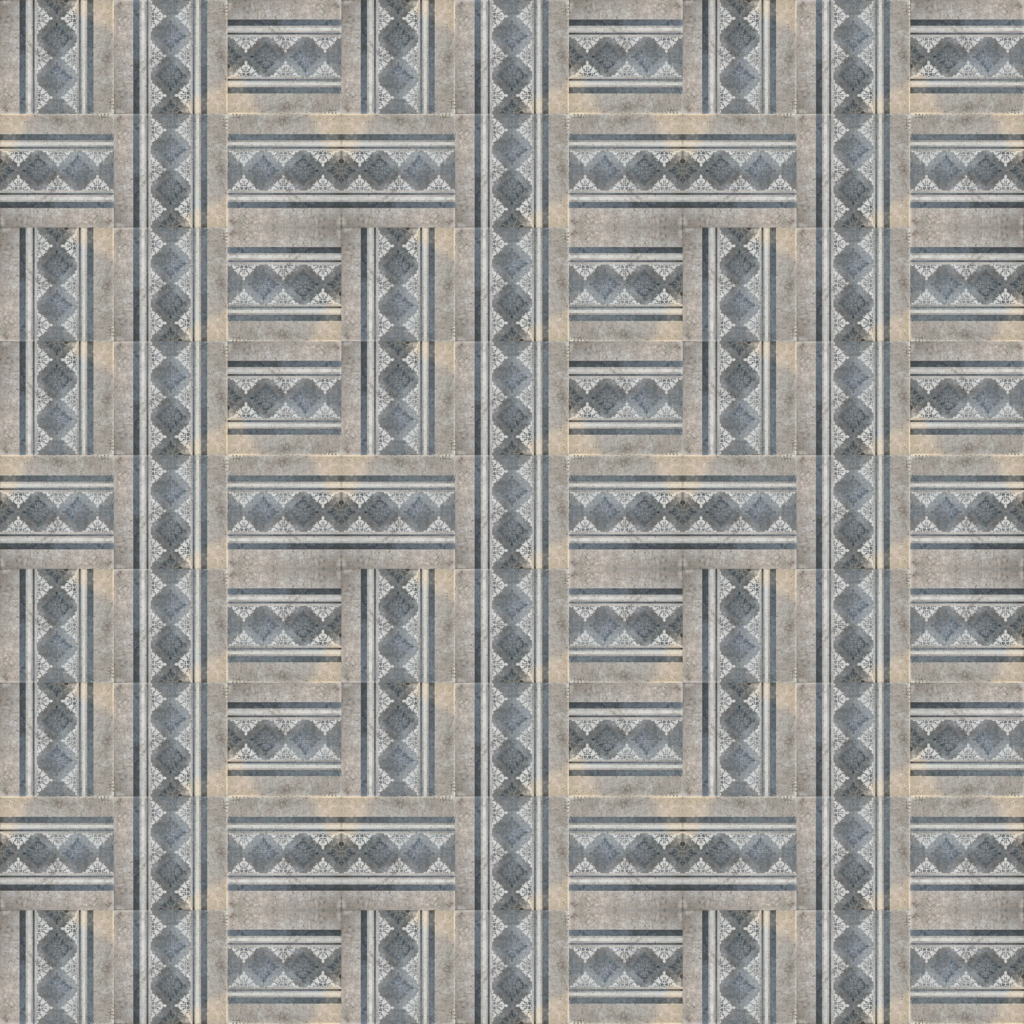
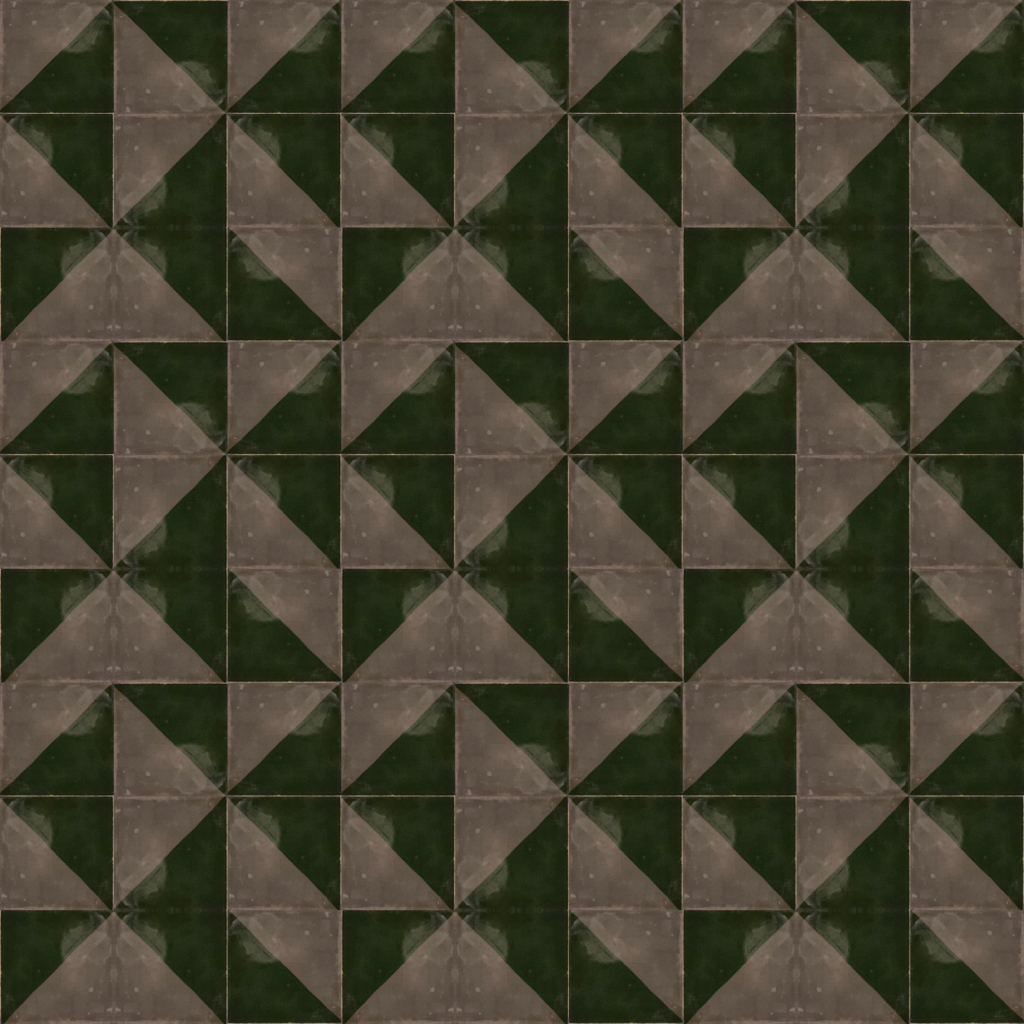
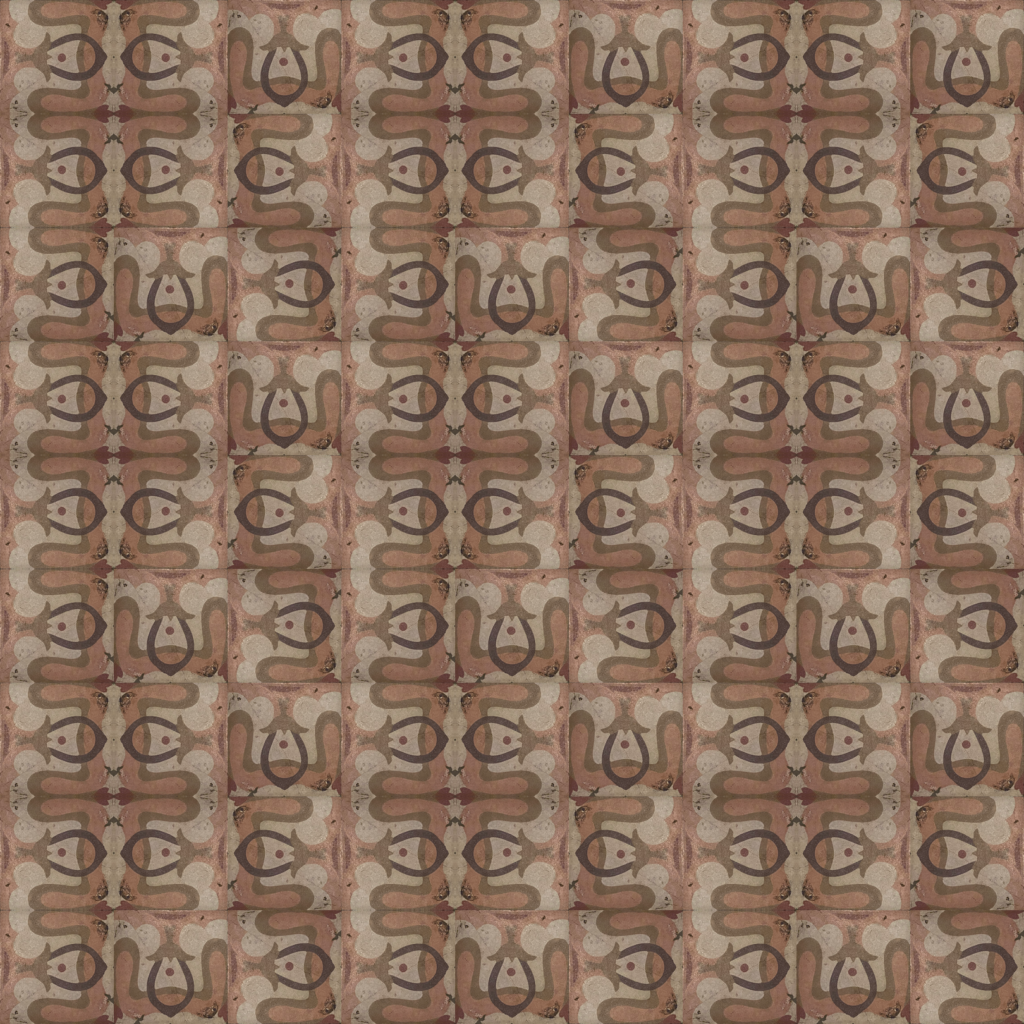
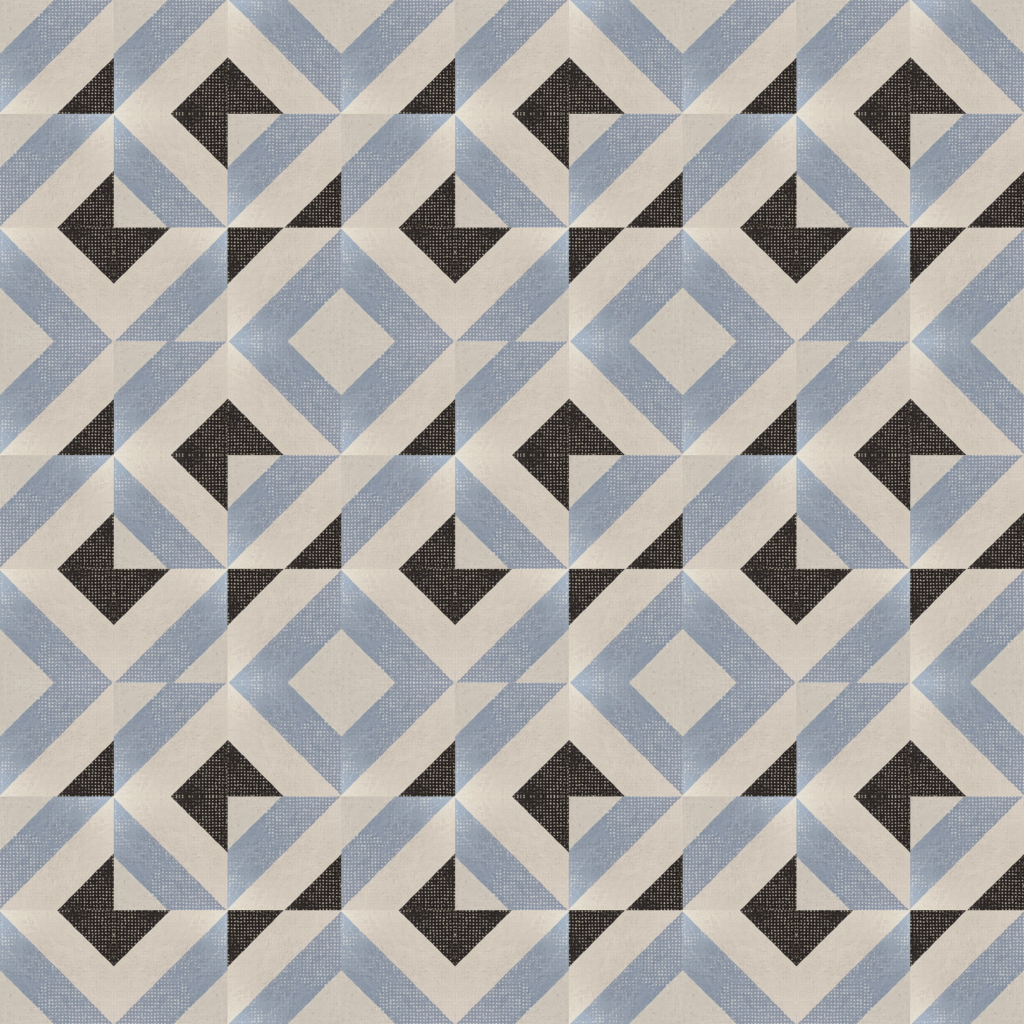
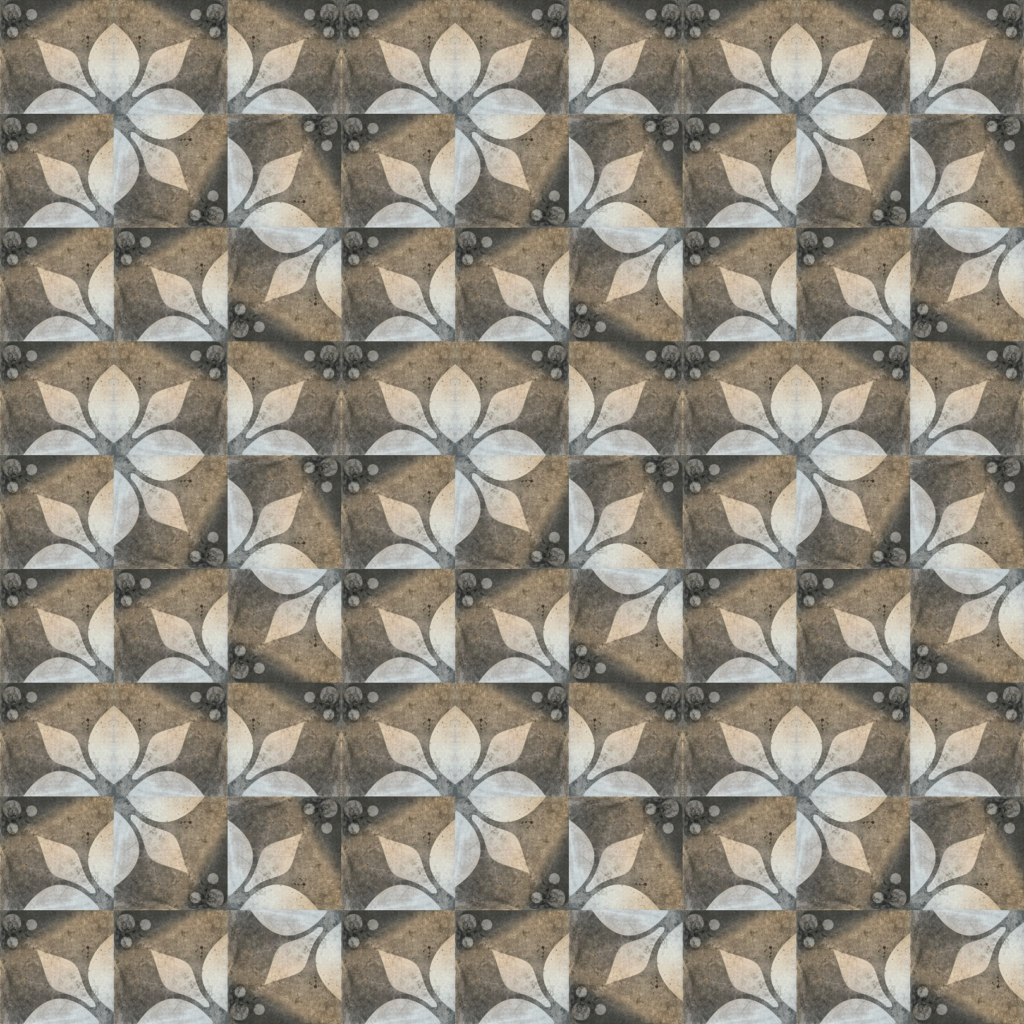
Ever since Bill Keehn and I started writing our paper, “Counting Tilings of the 𝑛 × 𝑚 Grid, Cylinder, and Torus,” I’ve been noticing and taking photos of tiles that I see that exhibit interesting symmetries.
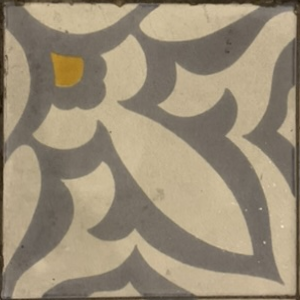
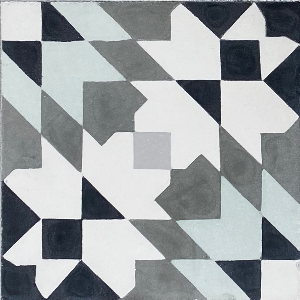
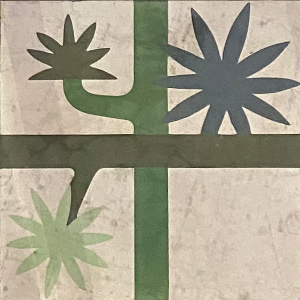
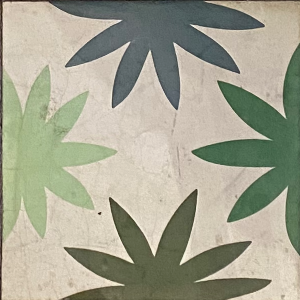
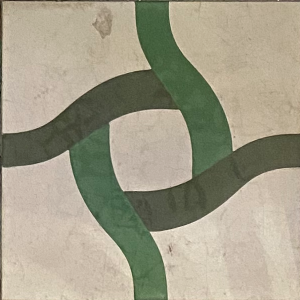
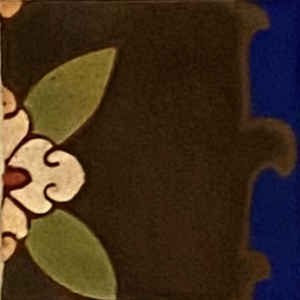
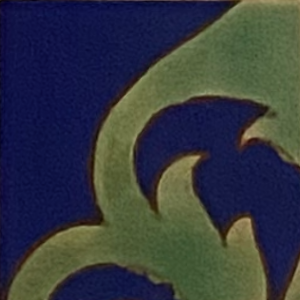


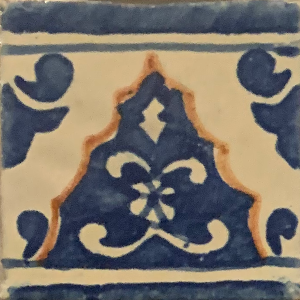
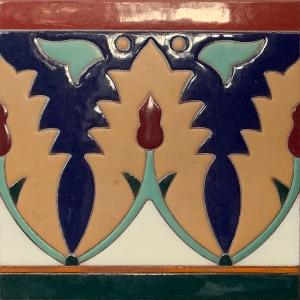
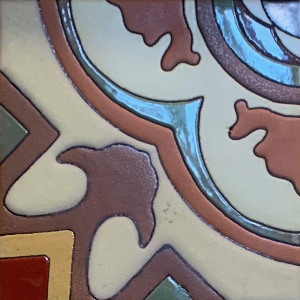
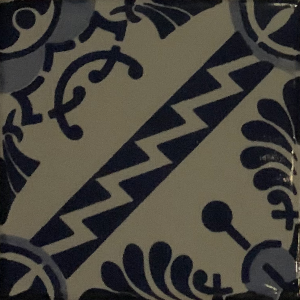
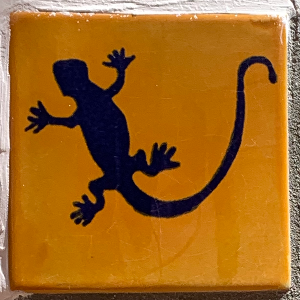
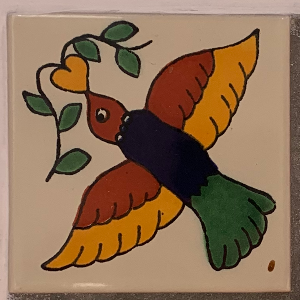
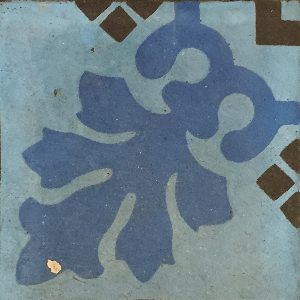
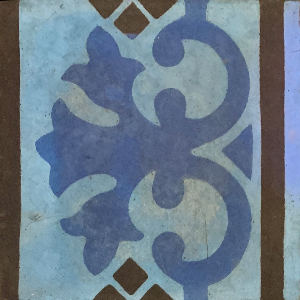
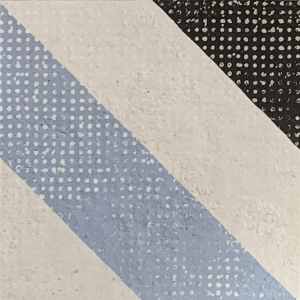
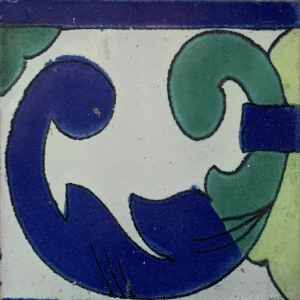
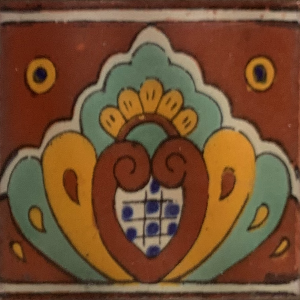
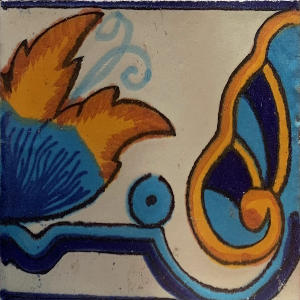
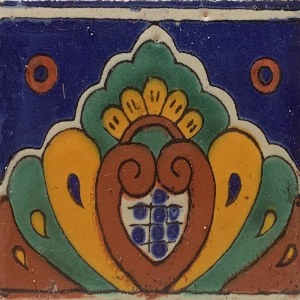
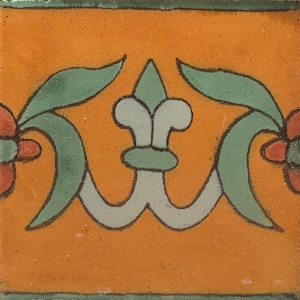
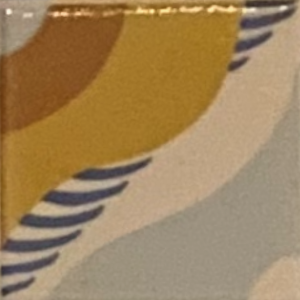
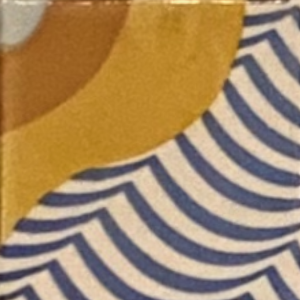
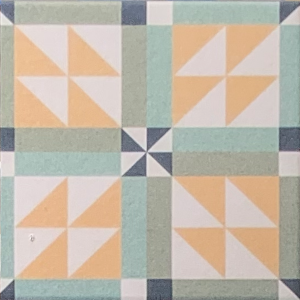
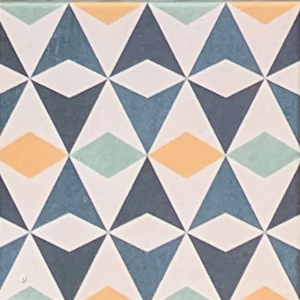
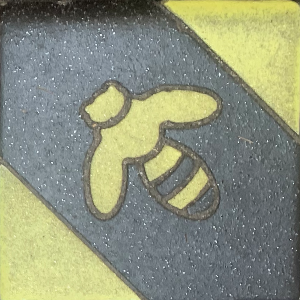
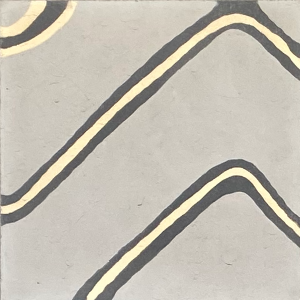
My wife will sometimes kid on the square: “Whenever you take your phone out to take a picture of a tile, you also have to take a picture of me.”
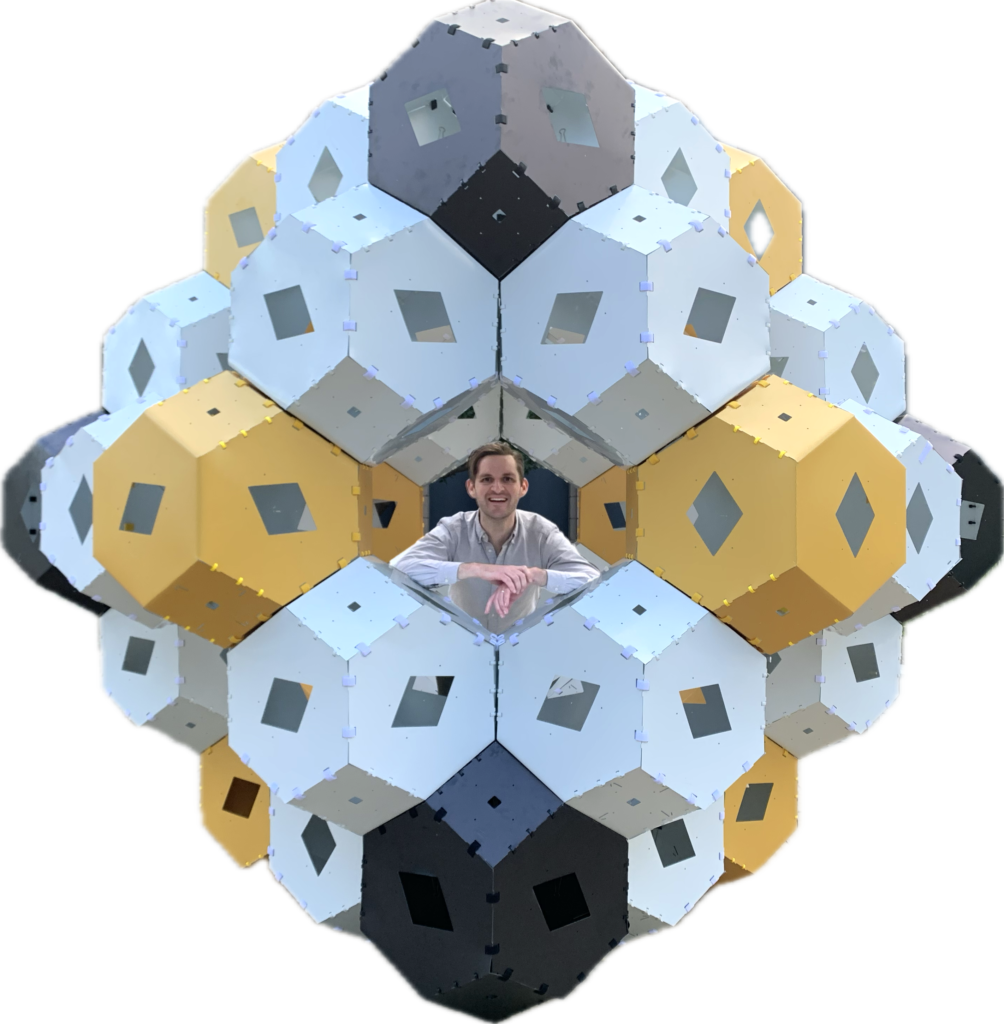
CPP Job Talk
When I gave my job talk at CPP, I included some of these tiles in my most labor-intensive slide transition:
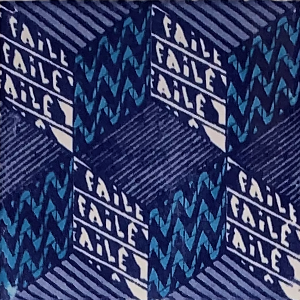
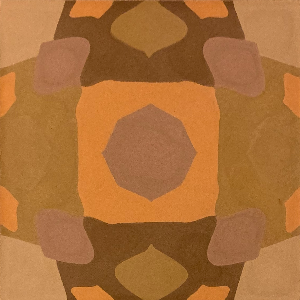
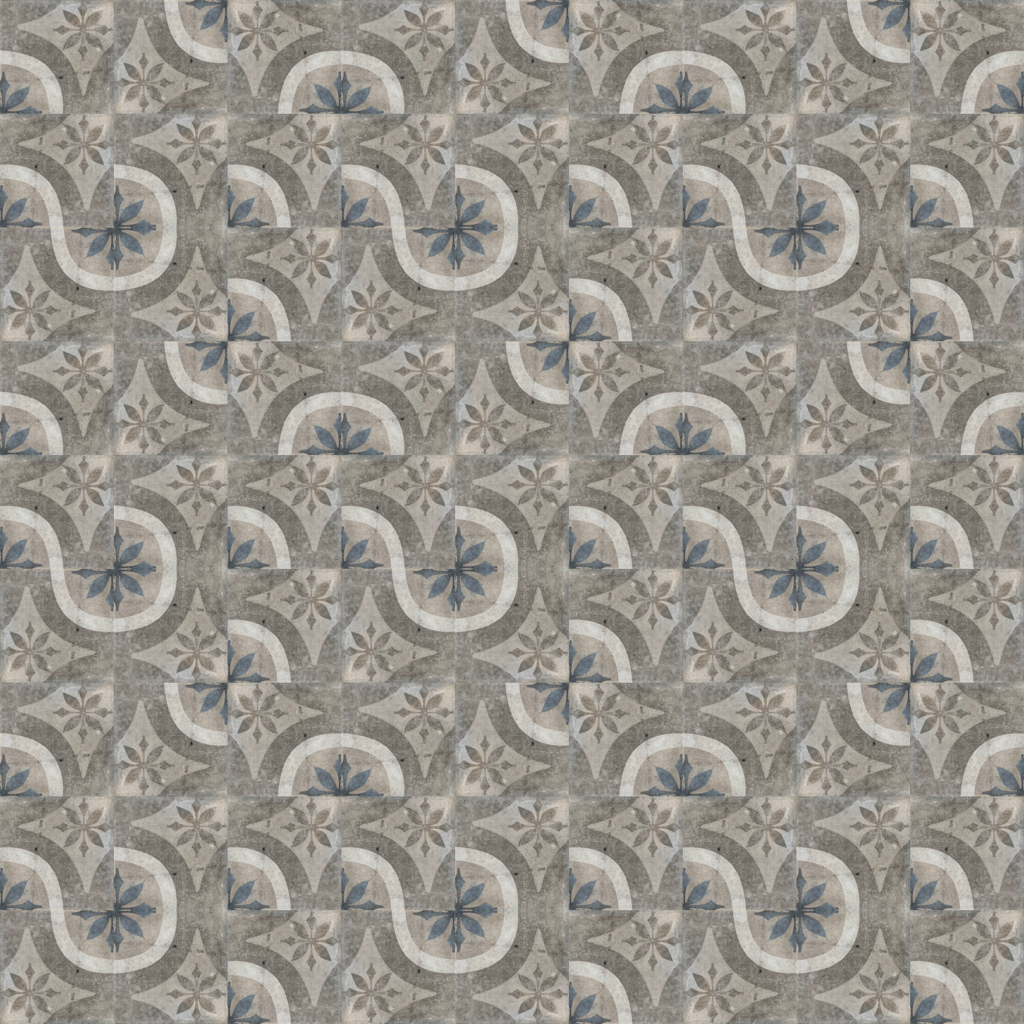
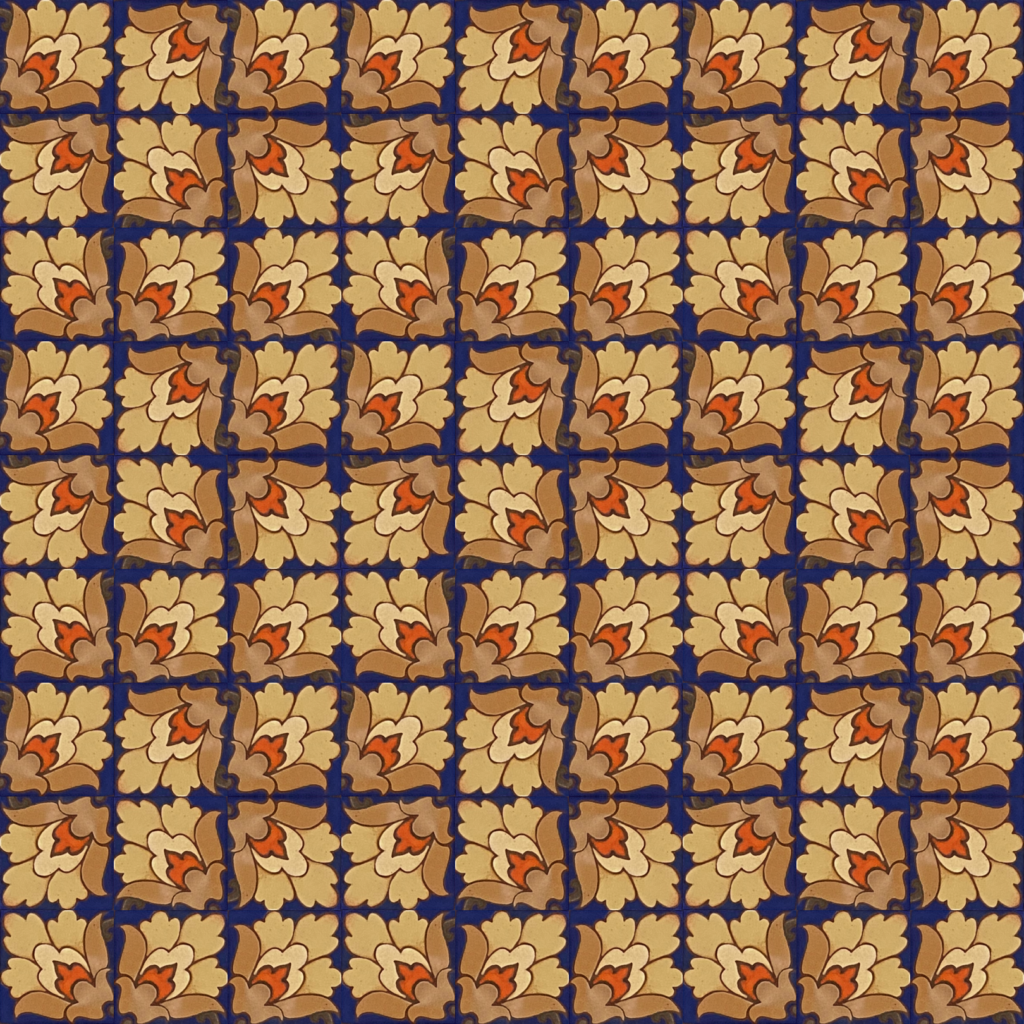
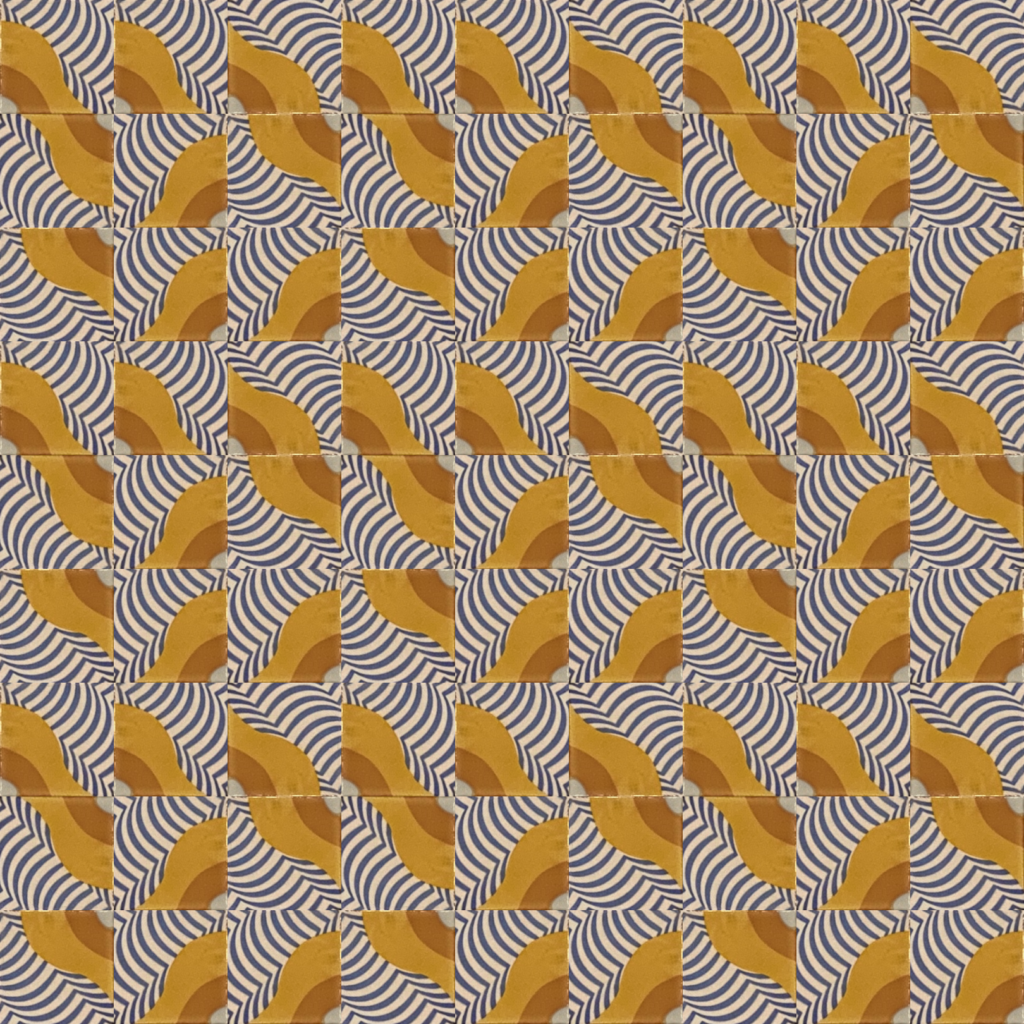
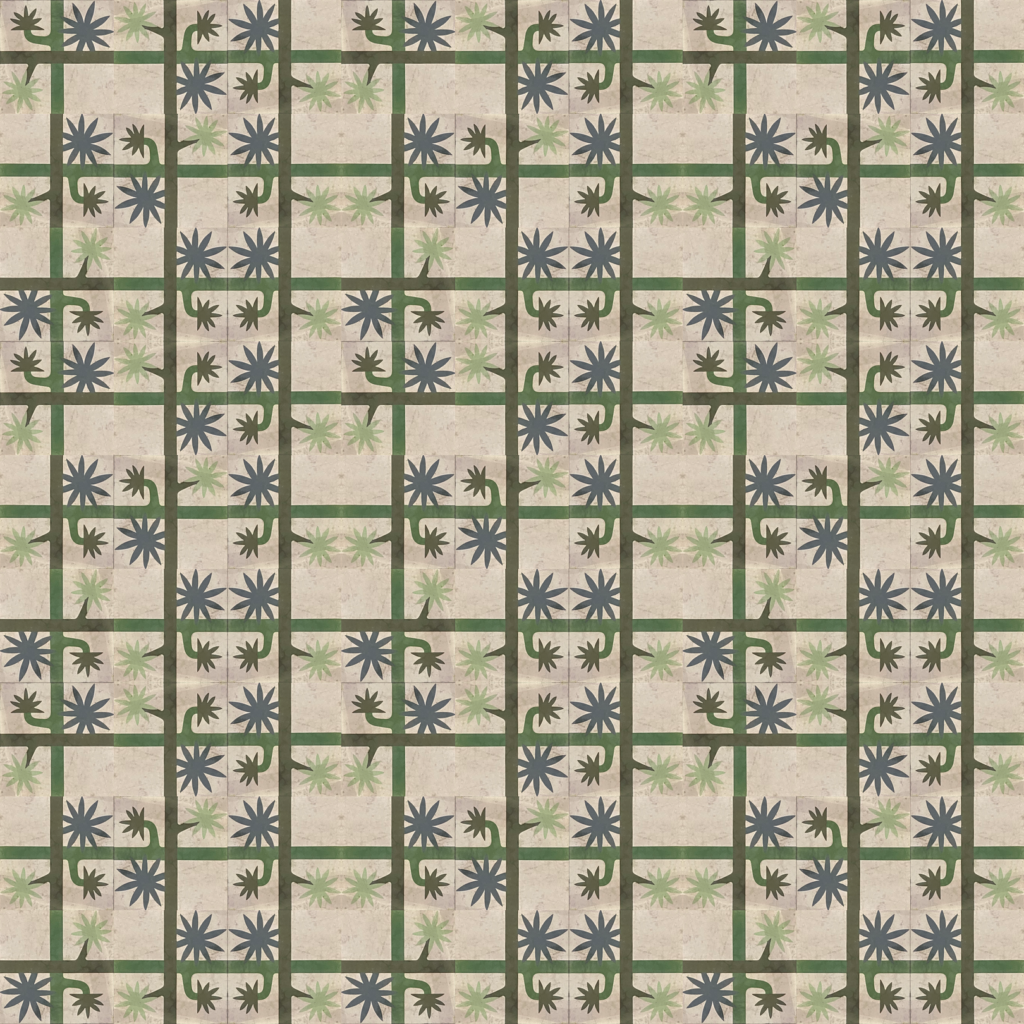
Random Tiling Bot
I used some of these photos to programmatically generate tilings, inspired by Dave Richeson’s (@divbyzero.bsky.social) Bluesky bot Random Tiling Bot.


Torus tilings on a torus
Mathematica code
Here’s the code for drawing the patterns on a torus:
faceImage = ImageCrop[Import["tiling_018.png"],1620/3];

torus[u_, v_, R_ : 2, r_ : 1] := {
  (R + r Cos[v]) Cos[u],
  (R + r Cos[v]) Sin[u],
  r Sin[v]
};

frames = Table[
  ParametricPlot3D[torus[u, v], {u, 0, 2 Pi}, {v, 0, 2 Pi},
    TextureCoordinateFunction -> ({#4, #5 + a} &),
    PlotStyle -> Texture[faceImage],
    Mesh -> None, Lighting -> "Neutral",
    Boxed -> False, Axes -> False, Method -> {"ShrinkWrap" -> True},
    Background -> Black, ImageSize -> Large
  ],
  {a, 0, 1 - 1/120, 1/120}
]
Python Code
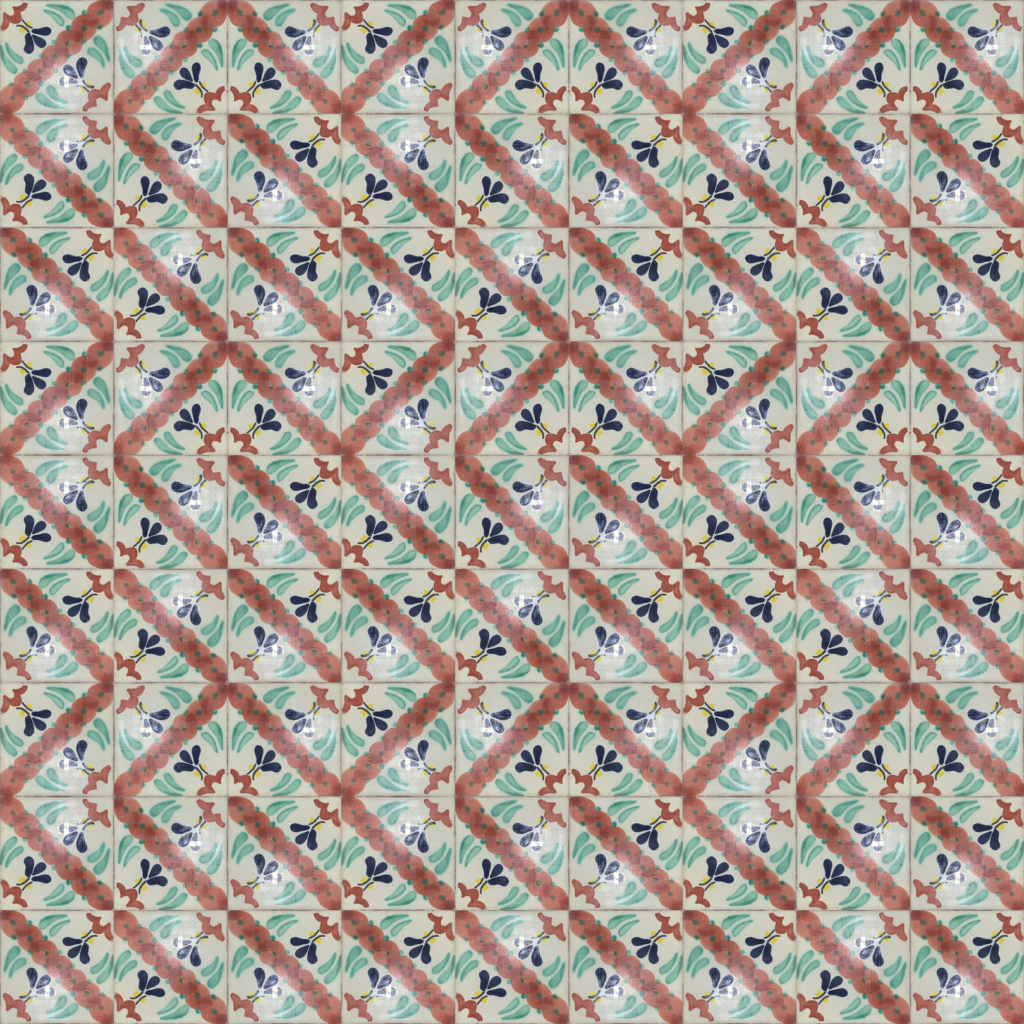
Here’s code that randomly picks one of the above tiles, and draws rotations and reflections of it in a n×m grid. (I saved the tile images under the path
/tiles/tile_000.png.)from PIL import Image import random import os current_dir = os.path.dirname(os.path.abspath(__file__)) tiling_path = current_dir + "/generated/" generation = len(os.listdir(tiling_path)) gen_string = str(generation).zfill(3) random.seed(generation) path = current_dir + "/tiles/" tile_name = random.choice([f for f in os.listdir(path) if f[-3:]=="png"])[0:-4] big_tile_design = Image.open(path + tile_name + ".png") tile_design = big_tile_design.resize((180, 180), Image.LANCZOS) (n,m) = (3,3) # n × m torus canvas = Image.new("RGB", (180*n*3, 180*m*3)) tile_symmetries = [ tile_design, tile_design.rotate(90), tile_design.rotate(180), tile_design.rotate(270), tile_design.transpose(Image.FLIP_LEFT_RIGHT), tile_design.transpose(Image.FLIP_LEFT_RIGHT).rotate(90), tile_design.transpose(Image.FLIP_LEFT_RIGHT).rotate(180), tile_design.transpose(Image.FLIP_LEFT_RIGHT).rotate(270) ] tiles = random.choices(tile_symmetries, k=n*m) for j in range(m*3): for i in range(n*3): tile_choice = tiles[n*(j%m) + (i%n)] canvas.paste(tile_choice, (i * 180, j * 180)) canvas.save(tiling_path + "tiling_" + gen_string + ".png")Maybe I’ll make a bot? 😏
-
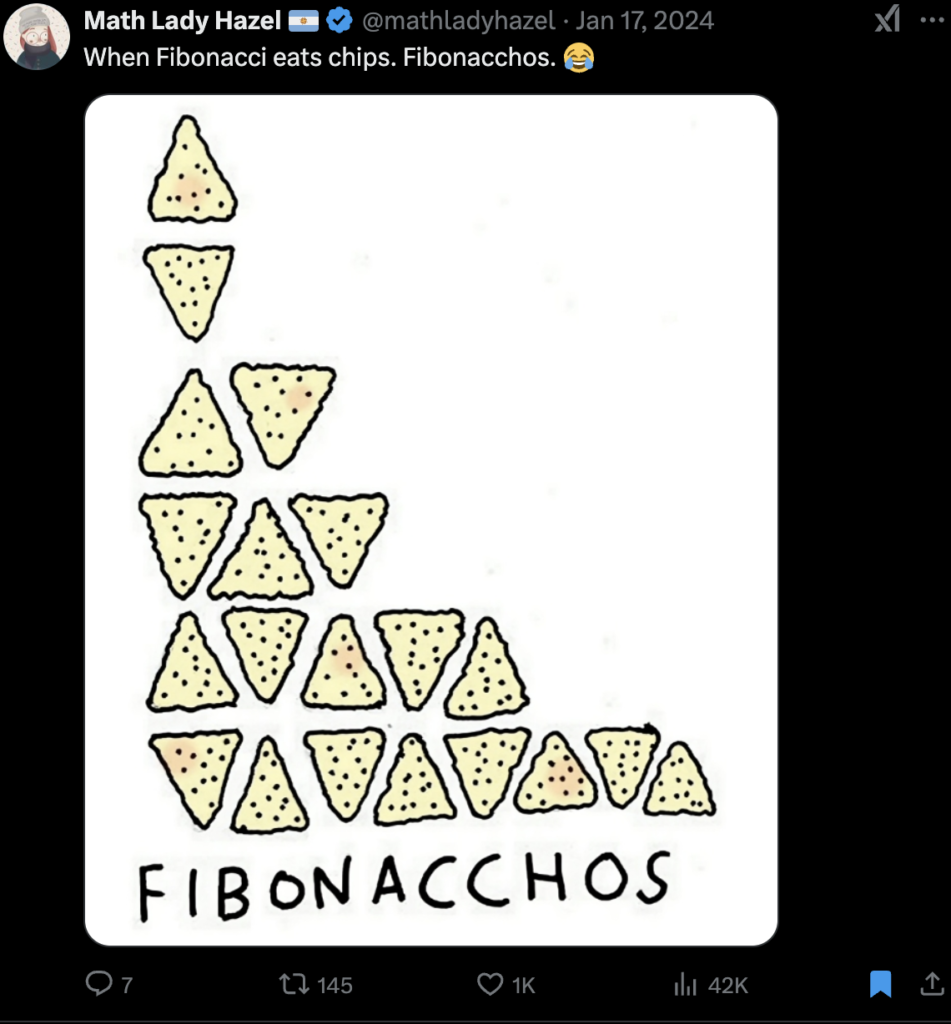
Fibonachos
A few weeks ago I was going through my saved tweets, and I saw this one from Math Lady Hazel which reminded me of a story from early 2017 that I played a small part in.
In January 2017, reddit user Teblefer asked the following question:
Two people are sharing a plate of nachos. They take turns dividing the nachos, each taking the nth Fibonacci number of nachos on the nth turn. When the number of nachos left is less than the next Fibonacci number, they start the sequence over. What number of nachos (less than 500) requires the most number of restarts? How would you generate numbers of nachos with a high number of restarts?
I computed the first few terms, added them to the OEIS as A280521 and A280523, and wrote:
I’m shocked that I didn’t find this sequence in the OEIS!
a(1)  = 1 via [1]
a(2)  = 1 via [1, 1]
a(3)  = 2 via [1, 1], [1]
a(4)  = 1 via [1, 1, 2]
a(5)  = 2 via [1, 1, 2], [1]
a(6)  = 2 via [1, 1, 2], [1, 1]
a(7)  = 1 via [1, 1, 2, 3]
a(8)  = 2 via [1, 1, 2, 3], [1]
a(9)  = 2 via [1, 1, 2, 3], [1, 1]
a(10) = 3 via [1, 1, 2, 3], [1, 1], [1]
a(11) = 2 via [1, 1, 2, 3], [1, 1, 2]
a(12) = 1 via [1, 1, 2, 3, 5]
Here are where records appear (I also didn’t find this in the OEIS):
a(1)    = 1
a(3)    = 2
a(10)   = 3
a(30)   = 4
a(84)   = 5
a(227)  = 6
a(603)  = 7
a(1589) = 8
a(4172) = 9
Conjecture: Records appear at A215004(2n).
A215004(0) = A215004(1) = 1; for n>1, A215004(n) = A215004(n-2) + A215004(n-1) + floor(n/2).
Neil Sloane’s Winter Fruits
Later that month on January 26, 2017, Neil Sloane (the founder of the OEIS) gave a talk in Doron Zeilberger’s Experimental Mathematics Seminar at Rutgers titled “Winter Fruits: New Problems from OEIS December 2016–January 2017.” You can see a PDF of the slides here.
The lecture was recorded, and when I first got to the 12:50 minute mark, I was surprised to see my name appear on the screen.

Other nacho sequences
You can play the “Fibonachos” game for other sequences too, and Neil’s slides contained the following table:

\(S\) \(a(n)\) Records Fibonacci A280521 A280523 \(n\) A057945 A006893 \(\frac{n(n+1)}{2}\) A281367 A281368 \(2^n\) A100661 A000325 \(n^2\) A280053 A280054 Related sequences
While writing this post, I submitted OEIS sequence A382814: the number of Nachos that the first player gets.
A good rule of thumb is that the player who draws last before the first reset gets the greatest number of nachos.
I have a conjecture that I bet you could prove: let \(n\) be the number of nachos in the starting pile. When \(n > 32\), the last player to take nachos before “the number of nachos left is less than the next Fibonacci number, [and] they start the sequence over” is the player that ends up with the greatest number of nachos in the end.
Prove it, contribute the proof to the OEIS, and let me know on Bluesky @peterkagey.com.
-
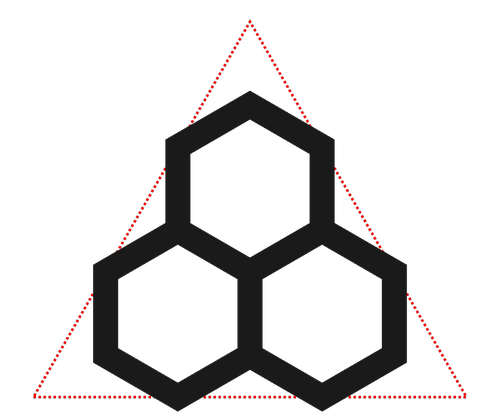
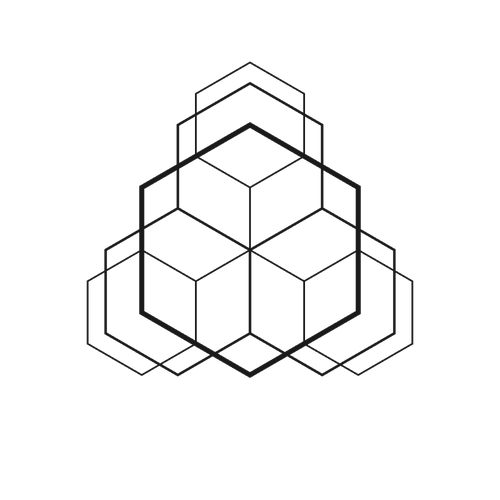
Hexagons in Triangles
At the beginning of April, I posted two animations related to hexagons inscribed inside of an equilateral triangle. Here I discuss a bit about the origin of these animations and give code so that you can reproduce these on your own.
Gathering 4 Gardner gift exchange
I first stumbled across this idea at the beginning of 2024 when I was making cards based on Parity Triangles for the G4G15 gift exchange: I needed to choose the size of the hexagonal arrays so that they all fit on the same triangular card, regardless of the number of rows.

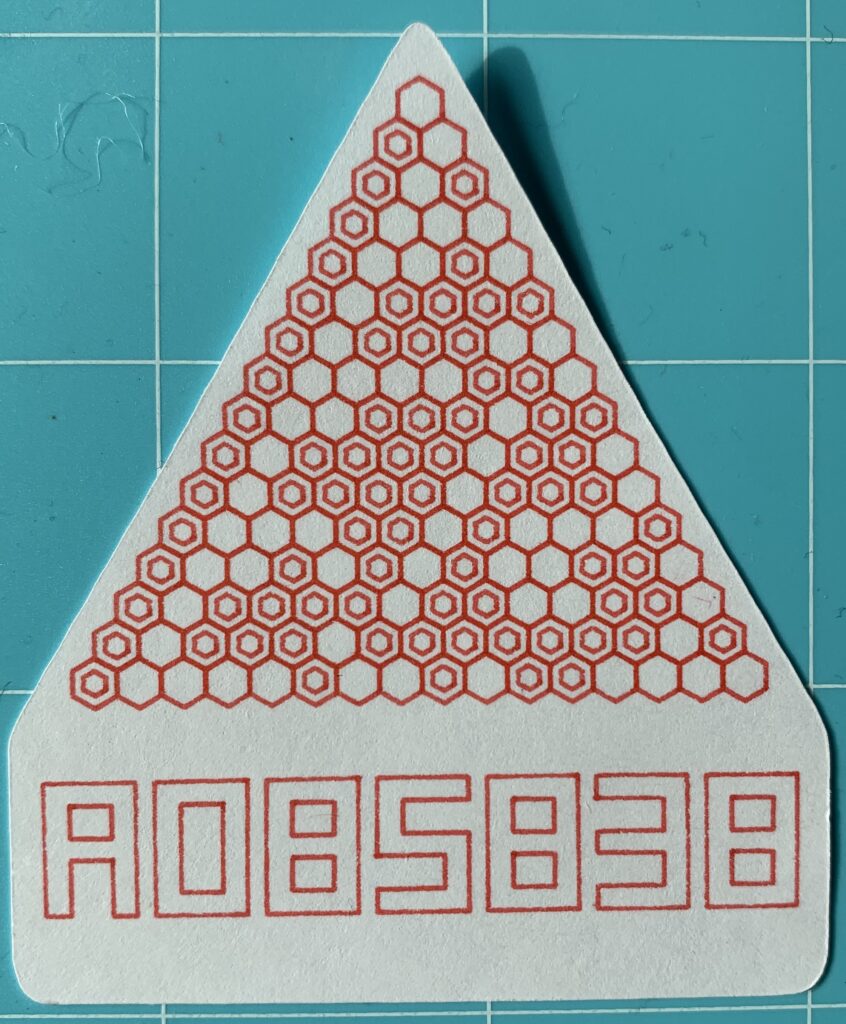

Then I started superimposing them, which created a cool effect.

Mathematica Code
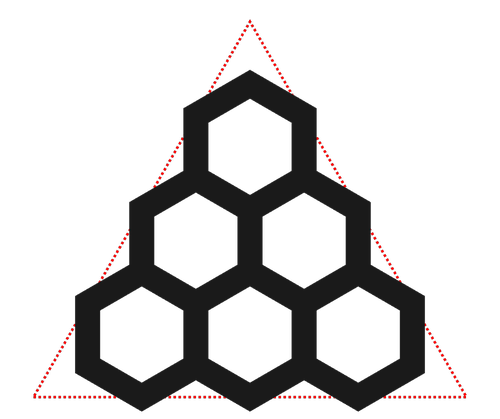
The following code draws \(n\) rows of hexagons inside of the equilateral triangle with vertices \((0,0)\), \((2,0)\), and \(1, \sqrt{3}/2\).
Hexagon[{a_, b_}, n_] := Module[{x, y, r},
   r = 2/Sqrt[3] 1/(n + 1);
   x = (1 + (2 a - b)/2) Sqrt[3] r; y = r (3/2 b + 1);
   Polygon[
    Table[{x + r Cos[\[Pi]/6 (2 i + 1)],
      y + r Sin[\[Pi]/6 (2 i + 1)]}, {i, 0, 5}]]
   ];
HexTri[n_] :=
  Flatten[Table[Hexagon[{a, b}, n], {a, 0, n - 1}, {b, 0, a}]];
First animation
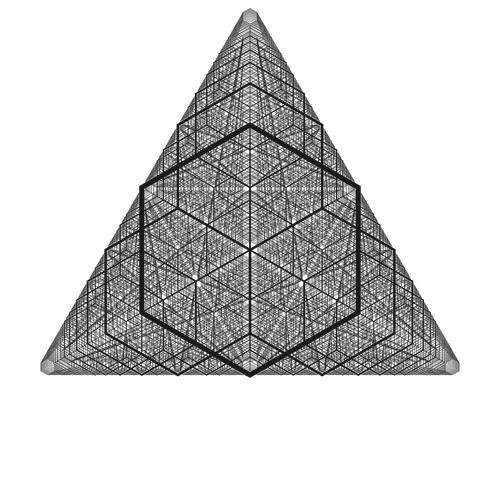
The first animation opacity of the boundaries.
n = 40;
OrderIt = Reverse;
AddForms[hexTris_, t_, orderIt_] :=
 Module[{m, styleFunction, color, thickness},
  m = Length[hexTris];
  color =
   Function[i, ColorData["Rainbow"][Mod[i*Floor[(m - 1)/2], m]/m]];
  thickness[i_] := Thickness[0.01/(1 + Sqrt[i])];
  opacity[i_] := Opacity[Median[{0, n (t - (i - 1)/n), 1}]];
  styleFunction =
   Function[i,
    Directive[{color[i],
      EdgeForm[{color[i], thickness[i], opacity[i]}]}]];
  Riffle[
   styleFunction /@ orderIt[Range[m]],
   hexTris
   ]
  ]
initialStyle = {Opacity[0/100],
   EdgeForm[{Thickness[0.0002], JoinForm["Round"]}]};
frames = Manipulate[
  Graphics[
   Join[
    initialStyle,
    AddForms[HexTri /@ OrderIt[Range[n]], 1 - Sqrt[1 - t^2], OrderIt]
    ],
   PlotRange -> {{0, 2}, {0, Sqrt[3]}},
   ImageSize -> 500],
  {{t, 1/2}, 0, 1, 1/119}
  ]
Second animation
The second video is made by increasing the thickness of the edges to fit the subsequent triangles of hexagons.
n = 20;
colors = Table[ColorData["Rainbow"][Mod[3*i, n]/n], {i, 0, n - 1}];
width = 4/3 Sqrt[3];
Interp[a_, b_] := (2 Sin[Pi/3])/
   width ((2 (-a + b))/(Sqrt[3] (1 + a) (1 + b)));
frames = Table[
   t = 1.99 + (n - 1.99)/2.001 (1 - Cos[Pi*s]);
   Graphics[
    {Opacity[0], EdgeForm[Opacity[0.5]]}~Join~
     Table[{EdgeForm[Thickness[Interp[i, t]]], EdgeForm[colors[[i]]]}~
       Join~HexTri[i], {i, 1, n}],
    PlotRange -> {{0 - ((width - 2)/2),
       2 + ((width - 2)/2)}, {-(Sqrt[3]/3), Sqrt[3]}},
    AspectRatio -> 1,
    ImageSize -> 1080,
    Background -> Black
    ],
   {s, 0, 1 - 1/100, 1/100}
   ];