Hello! I’m Peter!
Blog
-
Pour Le Science and the anti-Sum-Product Problem
In March 2021, I got an out-of-the-blue email from OEIS editor Michel Marcus which totally delighted me. He wrote:
This afternoon I went to the library.
And I was browsing “Pour La Science” the French version of the Scientific American.
And here is what I saw.I like the mysterious tone.
He included this photo of an excerpt of an article, which on the first line mentioned an OEIS sequence of mine (with my name slightly misspelled):

Michel Marcus’s photo of an article in Pour La Science. (Translated below) The article, translated
Michel had sent me a snippet of the article “Addition et multiplication, des tables qui intriguent” by French Computer Science professor Jean-Paul Delahaye. I read French quite clumsily, so I sent it to my friend Alec, and he volunteered a translation.
Sloane [verb not pictured] of my sequence A337655, Peter Kagey, who must have been informed of changes to the encyclopedia, proposed this second way of accounting for addition and multiplication. This has yielded a new entry in the encyclopedia, the following A337946:
1, 3, 7, 12, 22, 30, 47, 61, 85, 113, 126, 177, 193, 246, 279, 321, 341, 428, 499, 571, 616, 686, 754, 854, 975, 1052, 1150, 1317, 1376, 1457, …
Impossible Little Tables
Let’s consider the fourth question. The response is negative this time: no, it’s not possible that the tables of addition and multiplication have simultaneously only a few distinct values. This is a result of Paul Erdős and Endre Szemerédi from 1983, which we state precisely here:
“There exist two constants \(C>0\) and \(e > 0\) such that, for the set \(E\) of real numbers of […]
Translation by Alec JonesA Sum-Product Problem
The article—or at least the part that I could make sense of—is about the opposite of Erdos’s Sum-Product Problem. This article explores questions about the greatest number of different values in the corresponding addition and multiplication tables for different sequences of positive integers.

Addition table for the first six terms of A005282, the lexicographically earliest infinite sequence with the maximum-sum property. 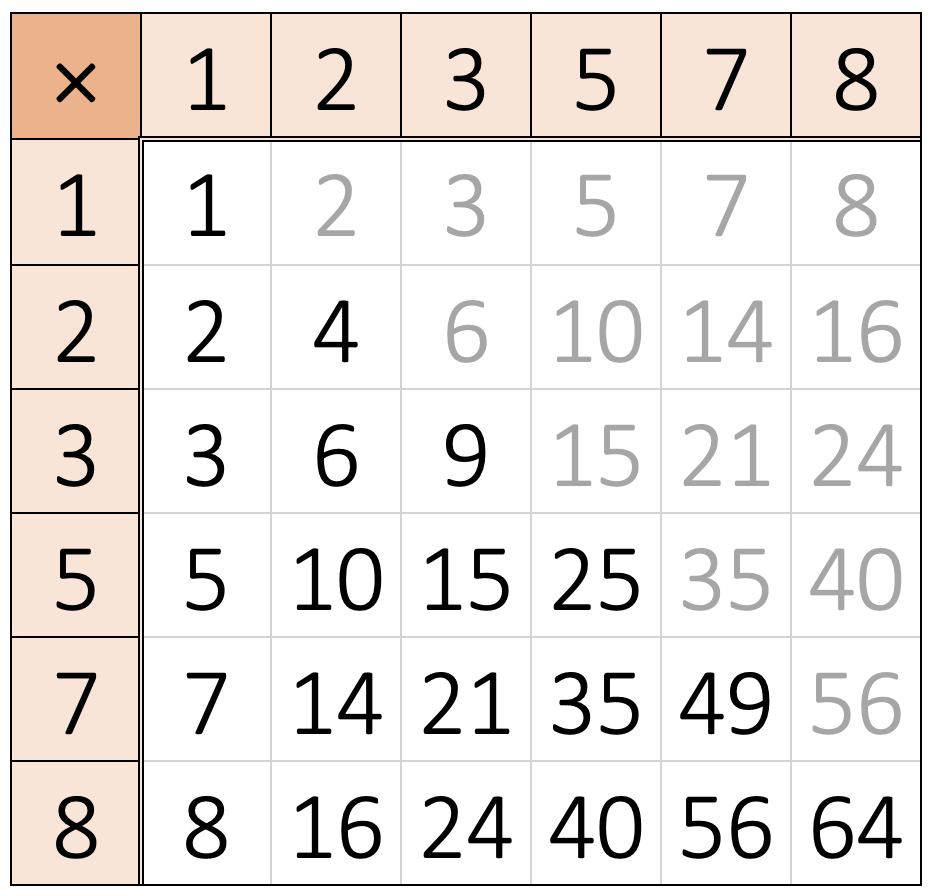
Multiplication table for the first six terms of A066720, the lexicographically earliest infinite sequence with the maximum-property property. Jean-Paul’s sequence, A337655, is the lexicographically earliest (greedy) sequence such that for all \(n\) both the addition and multiplication tables of the first \(n\) terms have \(\binom{n+1}{2}\) distinct terms (the greatest number).

Addition table for A337655. 
Multiplication table for A337655. The addition and multiplication tables share some values. For example, they both have a \(2\), a \(4\), a \(7\), a \(10\), and so on. My sequence, A337946, is similar to Jean-Paul’s but with the additional restriction that the addition and multiplication tables cannot have any values in common.

Addition table for A337946. 
Multiplication table for A337946. Some related sequences
I’ve recently added some new sequences to the OEIS related to these sequences.
One way of thinking of A066720 is that it’s the lexicographically earliest infinite sequence \(S = \(a_i\)_{i=1}^{\infty}\) such that for all \(n\) the set \(S_n = \{a_i\}_{i=1}^{n}\) consisting of the first \(n\) terms of \(S\) has the property that \(S_n \times S_n = \{xy \mid x, y \in S_n\}\) has exactly \(\binom{n+1}{2}\) elements—the most possible.
A347498: minimize the largest term
If instead of minimizing the lexicographic order, we instead minimize the size of the largest element, we get OEIS sequence A347498: for each \(n\), find the least \(m\) such that there exists a subset \(T_n \subseteq \{1, 2, \dots, m\}\) with \(n\) elements such that \(|T_n \times T_n| = \binom{n+1}{2}\). \(A347498(n)\) records the value of the \(m\)s.
For example, \(A347498(8) = 11\) as illustrated by the table below.

Multiplication table illustrating \(A347498(8) = 11\). A347499: Examples with minimized largest element
We wish to record examples of the sequences described in the above section. There are \(A348481(n)\) subsets of \(\{1,2,…,A347499(n)\}\) with the distinct product property, but we record the lexicographically earliest one in OEIS sequence A347499.
 n | Distinct product subset of {1,2,...,A347499(n)}
---+-------------------------------------------------------
 1 | {1}
 2 | {1, 2}
 3 | {1, 2, 3}
 4 | {1, 2, 3, 5}
 5 | {1, 3, 4, 5,  6}
 6 | {1, 3, 4, 5,  6,  7}
 7 | {1, 2, 5, 6,  7,  8,  9}
 8 | {1, 2, 5, 6,  7,  8,  9, 11}
 9 | {1, 2, 5, 6,  7,  8,  9, 11, 13}
10 | {1, 2, 5, 7,  8,  9, 11, 12, 13, 15}
11 | {1, 2, 5, 7,  8,  9, 11, 12, 13, 15, 17}
12 | {1, 2, 5, 7,  8,  9, 11, 12, 13, 15, 17, 19}
13 | {1, 5, 6, 7,  9, 11, 13, 14, 15, 16, 17, 19, 20}
14 | {1, 2, 5, 7, 11, 12, 13, 16, 17, 18, 19, 20, 21, 23}
For all of the known values, the lexicographically earliest subset begins with \(1\). Is this true in general?
A347570: Sums with more terms
Perhaps instead of asking when all sums \(x + y\) are distinct for \(x \leq y\), we want to know when all sums \(x_1 + x_2 + \dots + x_n\) are distinct for \(x_1 \leq x_2\leq \dots \leq x_n\). This family of sequences are sometimes called \(B_n\) sequences and have been studied by the likes of Richard Guy.
I’ve recorded the lexicographically earliest \(B_n\) sequences in OEIS sequence A347570.
n\k | 1  2   3   4    5     6     7      8
----+------------------------------------------
  1 | 1, 2,  3,  4,   5,    6,    7,     8, ...
  2 | 1, 2,  4,  8,  13,   21,   31,    45, ...
  3 | 1, 2,  5, 14,  33,   72,  125,   219, ...
  4 | 1, 2,  6, 22,  56,  154,  369,   857, ...
  5 | 1, 2,  7, 32, 109,  367,  927,  2287, ...
  6 | 1, 2,  8, 44, 155,  669, 2215,  6877, ...
  7 | 1, 2,  9, 58, 257, 1154, 4182, 14181, ...
  8 | 1, 2, 10, 74, 334, 1823, 8044, 28297, ...
I ask about this family of sequences in a recent question on Code Golf Stack Exchange.
Other ideas?
Did this post spark any related ideas? Let me know about them on Twitter @PeterKagey—I’d love to hear about them!
-
Zimin Words and Bifixes
One of the earliest contributions to the On-Line Encyclopedia of Integer Sequences (OEIS) was a family sequences counting the number of words that begin (or don’t begin) with a palindrome:
- Let \(f_k(n)\) be the number of strings of length \(n\) over a \(k\)-letter alphabet that begin with a nontrivial palindrome” for various values of \(k\).
- Let \(g_k(n)\) be the number of strings of length n over a \(k\)-letter alphabet that do not begin with a nontrivial palindrome.
- Number of binary strings of length \(n\) that begin with an odd-length palindrome. (A254128)
(If I had known better, I would have published fewer sequences in favor of a table, and I would have requested contiguous blocks of A-numbers.)
I must have written some Python code to compute some small terms of this sequence, and I knew that \(g_k(n) = k^n – f_k(n)\), but I remember being at in my friend Q’s bedroom when the recursion hit me for \(f_k(n)\): $$f_k(n) = kf_k(n-1) + k^{\lceil n/2 \rceil} – f_k\big(\lceil \frac n 2 \rceil \big)$$
“Bifix-free” words
One sequence that I didn’t add to the OEIS was the “Number of binary strings of length n that begin with an even-length palindrome”—that’s because this was already in the Encyclopedia under a different name:
A094536: Number of binary words of length n that are not “bifix-free”.
0, 0, 2, 4, 10, 20, 44, 88, 182, 364, 740, 1480, 2980, 5960, …A “bifix” is a shared prefix and suffix, so a “bifix-free” word is one such that all prefixes are different from all suffixes. More concretely, if the word is \(\alpha_1\alpha_2 \dots \alpha_n\), then \((\alpha_1, \alpha_2, \dots, \alpha_k) \neq (\alpha_{n-k+1},\alpha_{n-k+2},\dots,\alpha_n)\) for all \(k \geq 1\).
The reason why the number of binary words of length \(n\) that begin with an even length palindrome is equal to the number of binary words of length \(n\) that have a bifix is because we have a bijection between the two sets. In particular, find the shortest palindromic prefix, cut it in half, and stick the first half at the end of the word, backward. I’ve asked for a better bijection on Math Stack Exchange, so if you have any ideas, please share them with me!
In 2019–2020, Daniel Gabric, Jeffrey Shallit wrote a paper closely related to this called Borders, Palindrome Prefixes, and Square Prefixes.
Zimin words
A Zimin word can be defined recursively, but I think it’s most suggestive to see some examples:
- \(Z_1 = A\)
- \(Z_2 = ABA\)
- \(Z_3 = ABACABA\)
- \(Z_4 = ABACABADABACABA\)
- \(Z_n = Z_{n-1} X Z_{n-1}\)
All Zimin words \(Z_n\) are examples of “unavoidable patterns”, because every sufficiently long string with letters in any finite alphabet contains a substring that matches the \(Z_n\) pattern.
For example the word \(0100010010111000100111000111001\) contains a substring that matches the Zimin word \(Z_3\). Namely, let \(A = 100\), \(B = 0\), and \(C = 1011\), visualized here with each \(A\) emboldened: \( 0(\mathbf{100}\,0\,\mathbf{100}\,1011\,\mathbf{100}\,0\,\mathbf{100})111000111001\).
Binary solo from Bret at 1:26. I’ve written a Ruby script that generates a random string of length 29 and uses a regular expression to find the first instance of a substring matching the pattern \(Z_3 = ABACABA\). You can run it on TIO, the impressive (and free!) tool from Dennis Mitchell.
# Randomly generates a binary string of length 29.
random_string = 29.times.map { [0,1].sample }.join("")
p random_string
# Finds the first Zimin word ABACABA
p random_string.scan(/(.+)(.+)\1(.+)\1\2\1/)[0]
# Pattern:             A   B   A C   A B A
Why 29? Because all binary words of length 29 contain the pattern \(Z_3 = ABACABA\). However, Joshua Cooper and Danny Rorabaugh’s paper provides 48 words of length 28 that avoid that pattern (these and their reversals):
1100000010010011011011111100
1100000010010011111101101100
1100000010101100110011111100
1100000010101111110011001100
1100000011001100101011111100
1100000011001100111111010100
1100000011011010010011111100
1100000011011011111100100100
1100000011111100100101101100
1100000011111100110011010100
1100000011111101010011001100
11000000111111011011001001001100100100000011011011111100
1100100100000011111101101100
1100100101101100000011111100
1100110011000000101011111100
1100110011000000111111010100
1100110011010100000011111100
1101010000001100110011111100
1101010000001111110011001100
1101010011001100000011111100
1101101100000010010011111100
1101101100000011111100100100
1101101100100100000011111100The Zimin Word \(Z_2 = ABA\) and Bifixes
The number of Zimin words of length \(n\) that match the pattern ABA is equal to the number of of words that begin with an odd-length palindrome. Analogously, the number of words with a bifix is equal to the number of words that begin with an even-length palindrome. The number of these agree when \(n\) is odd.
I’ve added OEIS sequences A342510–A342512 which relate to how numbers viewed as binary strings avoid—or fail to avoid—Zimin words. I asked users to implement this on Code Golf Stack Exchange.
-
My Favorite Sequences: A263135
This is the fourth in my installment of My Favorite Sequences. This post discusses sequence A263135 which counts penny-to-penny connections among \(n\) pennies on the vertices of a hexagonal grid. I published this sequence in October 2015 when I was thinking about hexagonal-grid analogs to the “Not Equal” grid. The square-grid analog of this sequence is A123663.
A263135: Placing Pennies
The sequences A047932 and A263135 are about placing pennies on a hexagonal grid in such a way that maximizes the number of penny-to-penny contacts, which occurs when you place the pennies in a spiral. A047932, counts the contacts when the pennies are placed on the faces of the grid; A263135 counts the contacts with the pennies placed on the vertices.

Pattern of placing pennies in A047932. 
Pattern of placing pennies in A263135. While spiral shapes maximize the number of penny-to-penny contacts, there are sometimes non-spiral shapes that have the same number of contacts. For example, in the case of the square grid, there are \(A100092(n)\) such ways to lay down \(n\) pennies on the square grid with the maximum number of connections. Problem 108 in my Open Problems Collection asks about generalizing this OEIS sequence to other settings such as the hexagonal grid.

A047932(11) = 21 
A263135(22) = 27 Comparing contacts
Notice that the “face” pennies in A047932 can have a maximum of six neighbors, while the “vertex” pennies in A263135 can have a maximum of three. In the limit, most pennies are “interior” pennies with the maximum number of contacts, so \(A047932(n) \sim 3n\) and \(A263135(n) \sim \frac32n\).
Looking at the comparative growth rates, it is natural to ask how the number of connections of \(n\) face pennies compares to the number of connections of \(2n\) vertex pennies. In October 2015 I made a conjecture on the OEIS that this difference grew like sequence A216256.
Conjecture: For \(n > 0\), \[A263135(2n) – A047932(n) = \lceil\sqrt{3n – 3/4} – 1/2\rceil = A216256(n).\]
I believe that the sequence A216256 on the right hand side appears to be the same as the sequence “n appears \(\displaystyle\left\lfloor \frac{2n+1}{3} \right\rfloor\) times,” but I’d have to crack open my Concrete Mathematics book to prove it.
This is Problem 20 in my Open Problem Collection, and I’ve placed a small, $5 bounty on solving this conjecture—so if you have an idea of how to prove this, let me know in exchange for a latte! I’ve asked about this in my Math Stack Exchange question Circle-to-circle contacts on the hexagonal grid—so feel free to answer there or let me know on Twitter, @PeterKagey.

